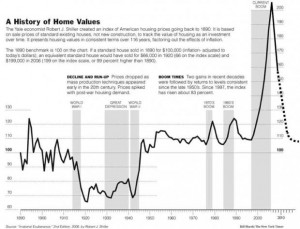
Here in a single graphic is the best illustration of what has happened the American economy over the last two years.
 It also to me speaks to the folly of the wise man. Bankers, Wall Street, and Government itself had this data and yet they all continued to play in the market expecting the prices to rise without end.
There are those who want to primarily blame the government. Both regulation and de-regualtion played a part.
There are those who want to primarily blame the banks. Certainly they sold mortgages to people who could not afford them and then offloaded the risk on to other.
There are those who want to primarily blame the debtors, for foolishly buying house they could not afford.
All are right and all share the blame, be we also have a cultural attitude that things can be had for free. That there is not a price to pay for things in life, and that is a culprit here as well. That is a problem we cannot fix with regulations or low taxes. I sometimes fear we will not fix it at all.

As someone living in one of the hardest hit areas of the country, I could have predicted this. I watched our home value rise at an obscene rate, We got our taxes one year (& we could afford to pay them) & it listed our home value at almost $200,000. Insane! It is a nice home but it isn’t THAT nice! We built it for around $70,000 and it needs some fixing up to make it worth even $120,000, if you ask me. I don’t know what was driving prices, other than greed, but I pity anyone who foolishly bought at the highest point of the market. It will never go up like that again.